


|
SADA Main Page
Free Downloads
Visualization
Sampling
Data Exploration
Risk Assessment
Geospatial Analysis
Geospatial Simulation
Decision Analysis
Cost Benefit Anaylsis
MARSSIM
TRIAD
Other Tools
Technical Support
Documentation
Coming Soon
Training
Education
Applications
Join SADA User Group
RAIS
Bugs
People
Email Us
Current SADA Webpage Vistors 
Previous SADA Webpage Visitors  |
Spatial Analysis and Decision Assistance
|
VisualizationThe visualization techniques in SADA are simple to use, easy to understand, and facilitate the data exploration, modeling, and decision analysis components present in SADA. A number of functions are available that will be recognizable to GIS analysts and introduce beginners to GIS tools. SADA can be applied to a wide range of applications where spatially distributed information plays a role. However, SADA was engineered with environmental characterization and remediation in mind. For the sake of simplicity we will talk about visualization with an emphasis on environmental applications. SADA provides a number of methods for the exploration of spatial data in two or three dimensions. By data we mean point sampled data as well as continuous models. Two-dimensional information is presented as simple xy plots or as GIS rich mappings. Three-dimensional information is presented in two ways: by 2-D slices (layers) or by 3-D volume. In the layer approach, the user can easily set the depth of each of the layer in order to suit the particular needs of the investigator. The 3-D volume approach does not depend on any layering scheme and shows all depths at once. The volume view can be customized with a variety of features that allow the user to better characterize contamination at depth. In order to allow data visualization with respect to site characteristics, SADA can accept map layers from a Geographic Information System (GIS) saved in a Data eXchange Format (DXF), Shape File Format (shp) or as a variety of raster formats including JPEG, GIF, and TIFF. Multiple layers can be imported into SADA, and the user can control the layer order and coloring scheme. In addition, the user can select a sub-region of the site to direct an analysis. This user-defined polygon will only consider data points within (or without) the interior of the delimited region when performing the analyses. If you don't have any GIS type data, it's ok. SADA's functionality does not require these files and there is no reduction in capabilities. This figure demonstrates the incorporation of GIS layers to show nearby roads and streams.
The below figure demonstrates how SADA uses a geospatial estimator on only the points defined within the polygon. The polygon can also be used in this manner to generate screening or risk results of subsets of the input data.
A great deal of control is available through customized legends and transparency tools. In the following image, the transparency of the model is increased to show the photographic overlay beneath.
Data can also be visualized in true 3d. SADA comes with a three dimensional visualization feature with a great deal of control over image rendering. The following image shows a 3d plume model derived in SADA with a chaircut away.
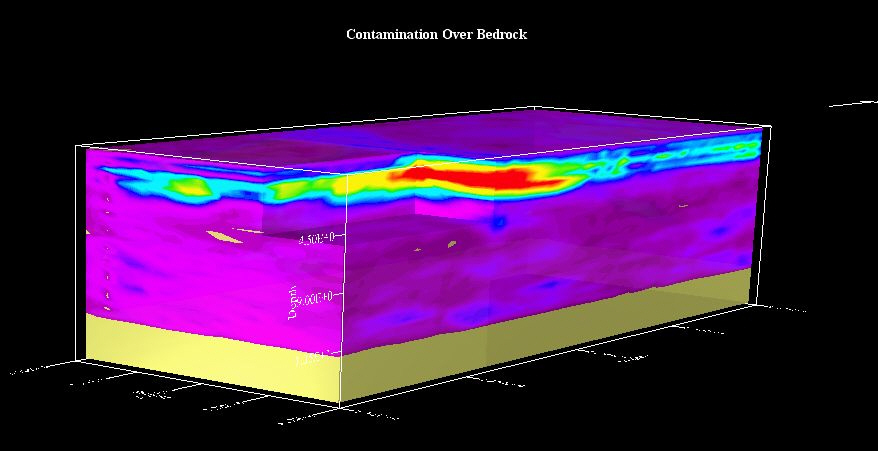
SADA's new model manipulation/post processing features allows users to overlay different kinds of information now. The following is an image of contamination estimates overlaid on a bedrock delineation.
The views shown so far are standard views in SADA. Users can also use the engineering annotations view to add additional information including a company logo in the lower left hand corner.
|


SADA Main Page Free Downloads Visualization Sampling Data Exploration Risk Assessment Geospatial Analysis Geospatial Simulation Decision Analysis Cost Benefit Anaylsis MARSSIM TRIAD Other Tools Technical Support Documentation Coming Soon Training Education Applications Join SADA User Group RAIS Bugs People Email Us