


|
SADA Main Page
Free Downloads
Visualization
Sampling
Data Exploration
Risk Assessment
Geospatial Analysis
Geospatial Simulation
Decision Analysis
Cost Benefit Anaylsis
MARSSIM
TRIAD
Other Tools
Technical Support
Documentation
Coming Soon
Training
Education
Applications
Join SADA User Group
RAIS
Bugs
People
Email Us
Current SADA Webpage Vistors 
Previous SADA Webpage Visitors  |
Spatial Analysis and Decision Assistance
|
Decision SupportSADA was designed to provide a variety of summarization, visualization, and modeling tools that aid in making informed decisions. Within that design is a set of tools directly related to decision-making issues. These are:
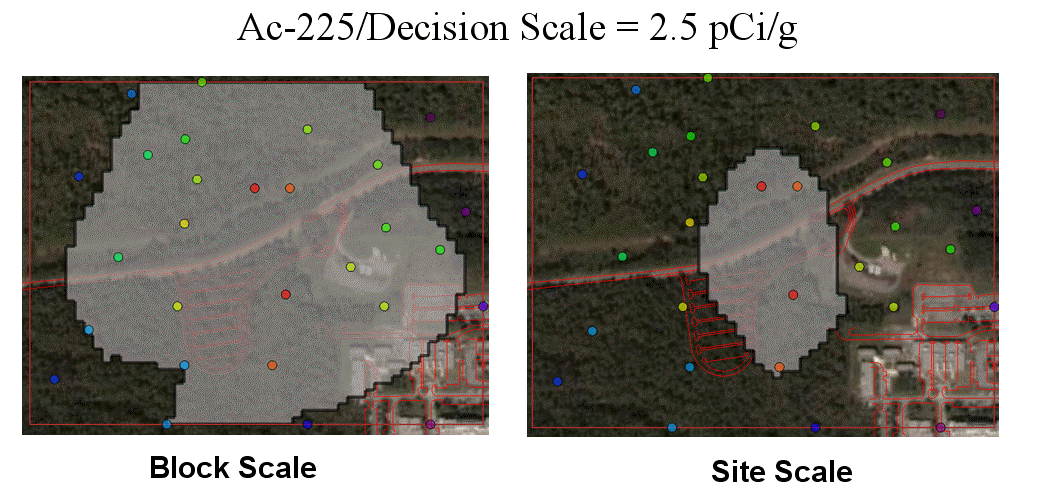
Defining An Area of ConcernAn area of concern (AOC) is defined as a region that is projected to exceed a decision criteria with some degree of certainty. This decision criteria can come from a human health model, ecological risk evaluation, or from your own custom or imported criteria. The spatial delineation of an AOC is usually based on the results of a geospatial model but can be manually constructed as well. You might have already read in the geospatial model discussion that you can import your own 2d or 3d model constructed somewhere outside SADA. The methods discussed here apply to imported models as well. There are two methods for determining an area of concern: block scale and site scale. In block scale, the decision criteria is applied to each cell model value individually. If the cell model value exceeds the criteria it is part of the area of concern. In site scale, the decision criteria is applied to the modeled site-wide average. In other words, all modeled cells values are averaged together and if this value exceeds the decision criteria, then some action must be taken. In this case, SADA simulates the remediation of the site beginning with the most contaminated block first, the next most contaminated block next, and so forth. During the remediation simulation, users can account for the fact that backfill or replacement media may not be pristine either. This is taken into consideration as the simulation unfolds. When the site-wide average falls below the decision criteria, those blocks that underwent remediation comprise the AOC. Block scale is always more conservative than site scale.
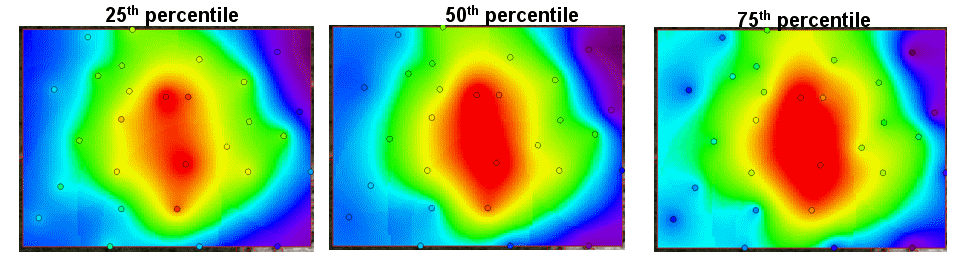
For geostatistical models, a measure of conservativity can be included by using percentile maps rather than simply using the standard kriging result. So if your geospatial model is the 75th percentile of each local estimation distribution, then the area of concern will be larger than for the standard estimation (e.g. 50th percentile/mean).
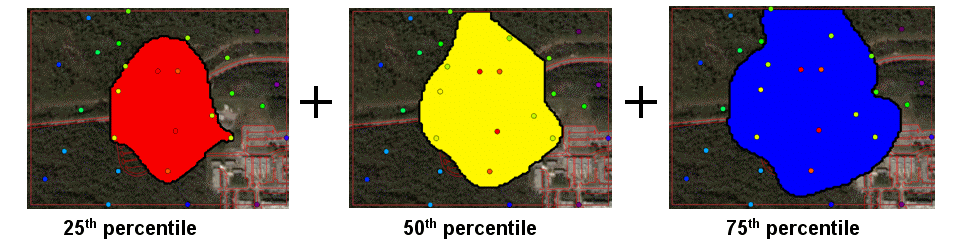
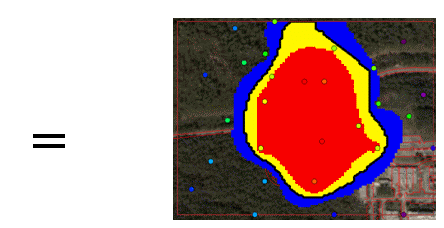
In fact, SADA can utilize the difference in percentile maps to account for uncertainty in the exact location of the AOC. Through a method refered to as percentile intervals, SADA computes spatial models at different percentiles and overlays them to show variation in the exactly boundary (and therefore volume) of the area of concern.
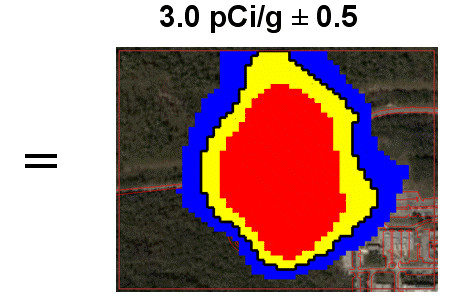
For deterministic methods (not geostatistical) such as natural neighbor and inverse distance, users can still evaluate some some degree of uncertainty through the use of value intervals. Like percentile methods, value intevals call for the calculation of three different area of concerns and then overlay them together. Rather than percentiles, users must specify a concentration range (for e.g. 3pC/g +/- 0.5).
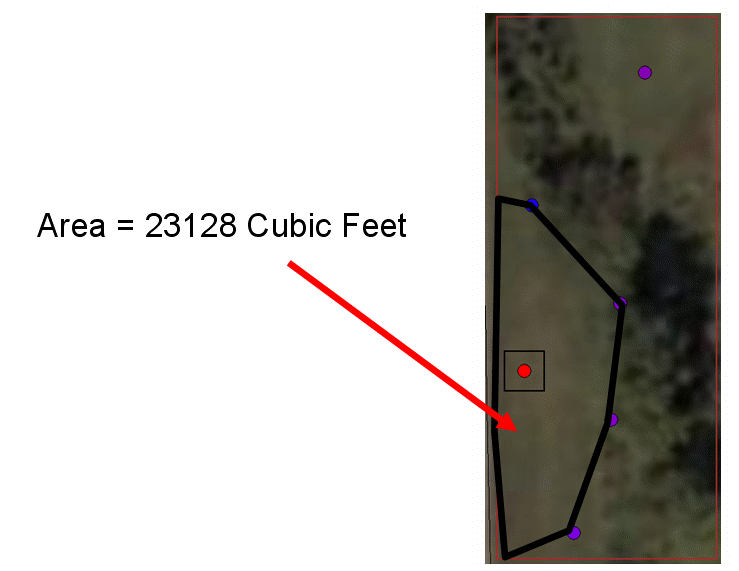
The interpretation of these individual regions can be quite involved and involves concepts akin to Type I and Type II error analysis. These are covered in depth in the users' guide. Both percentile and value intervals can be applied to both block and site scale frameworks. For each outcome,SADA reports both volume and mass. Volume, Mass, Overburden,and other Engineering Considerations Overburden For 3d applications, users can request SADA to consider the overburden as well. Overburden is clean medai that resides on top of contaminated media and must be removed. Processing costs for clean media are typically much less expensive than contaminated media. For soil applications, this usually amounts to sitting the clean soil to the side incurring little in transportation costs. Benching Angle For 3d applications, regulation may require a lay back or benching angle that creates a safe slope along the edges of a pit. SADA can include this in the analysis. Volumes associated with benching angles are included in the overburden estimation (see next). Volume/Mass For each AOC result, SADA will report the total volume of media including contaminated volume and overburden volume. Specification of a density parameter permits a mass to also be calculated. Cost Benefit AnalysisThe cost/benefit analysis draws its analysis from these area of concern maps and allows users to see the tradeoff between decision criteria, uncertainty, and volume/cost of remediation. Please visit the cost benefit page for detailed information. Secondary SamplingA suite of sampling designs based on the outcomes of data collection, geospatial models, and decision analysis are available. Please see the sample design page for a discussion. Manually Constructing AOCsIn some cases, an insufficient amount of data is available to build a geospatial model or prevailing conditions may suggest that modeling is inefficient. In these situations, users can simply create (using polygon drawing tools) their areas of concern manually. They may combine this with some polygon volume/area calculation tools to arrive at volume estimates. However, the automation in calculating overburden and benching angles has not been introduced yet. These will also have to be manually constructed and estimated.
|


SADA Main Page Free Downloads Visualization Sampling Data Exploration Risk Assessment Geospatial Analysis Geospatial Simulation Decision Analysis Cost Benefit Anaylsis MARSSIM TRIAD Other Tools Technical Support Documentation Coming Soon Training Education Applications Join SADA User Group RAIS Bugs People Email Us