


|
SADA Main Page
Free Downloads
Visualization
Sampling
Data Exploration
Risk Assessment
Geospatial Analysis
Geospatial Simulation
Decision Analysis
Cost Benefit Anaylsis
MARSSIM
TRIAD
Other Tools
Technical Support
Documentation
Coming Soon
Training
Education
Applications
Join SADA User Group
RAIS
Bugs
People
Email Us
Current SADA Webpage Vistors 
Previous SADA Webpage Visitors  |
Spatial Analysis and Decision Assistance
|
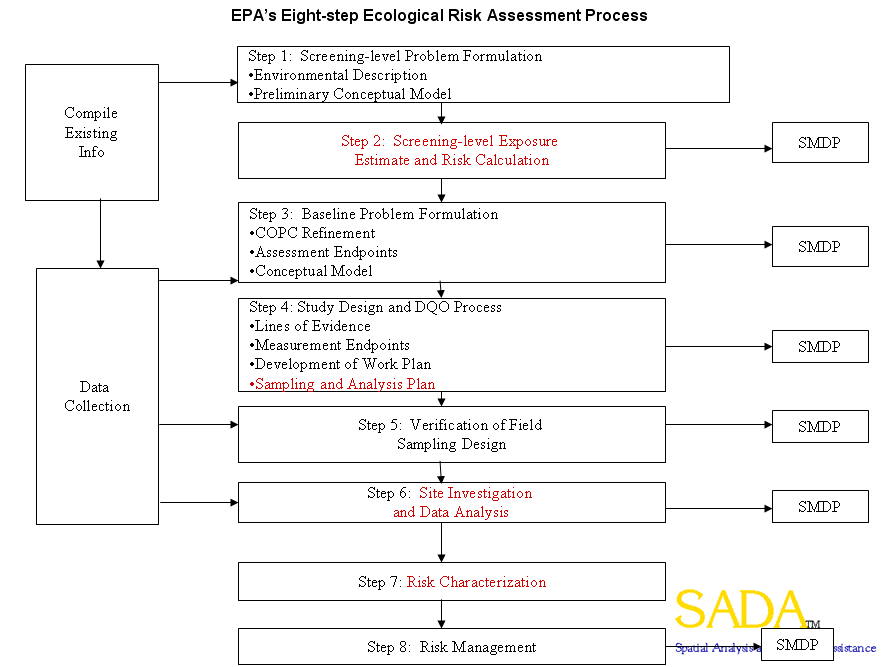
Ecological Risk AssessmentSADA supports a EPA approaches to ecological risk assessment in a number of key areas. When SADA is installed, it is accompanied by a substantial ecological benchmark database that can be used in tabular and spatial point screenings, risk maps, dose maps, uncertainty modeling, and decision support in determining the area of concerns or for locating new places for additional sampling. Ecological benchmarks found in the database cover over 100 contaminants for surface water, sediment, and soil. In addition, exposure modeling for 19 terrestrial species (birds and mammals) is available. Users can modify the EPA default exposure parameters for the risk models where available. The following image shows in red those places where SADA can support EPA's 8 step process for ecological risk.
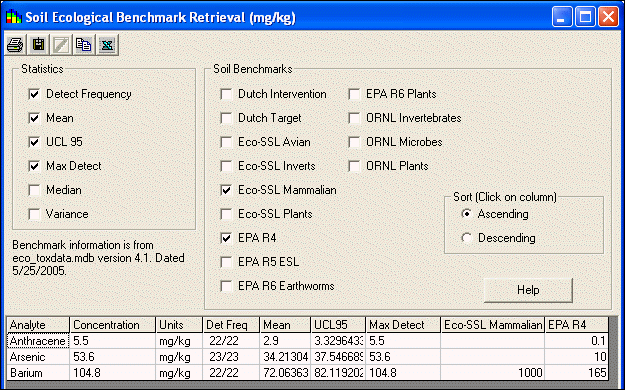
Viewing Benchmarks (table)
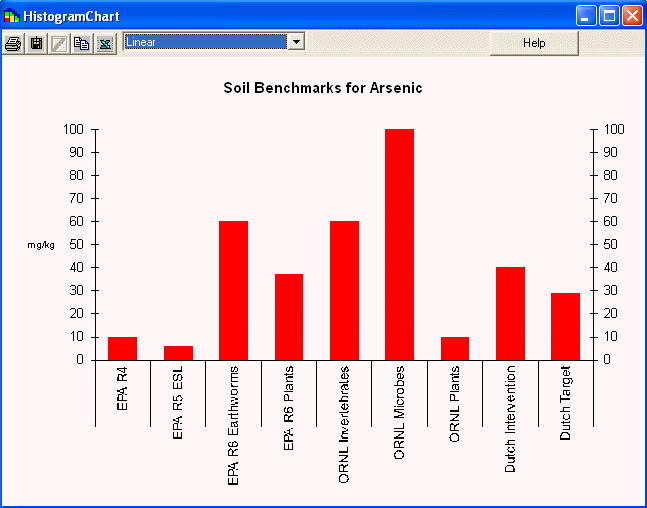
Viewing Benchmarks (histogram)
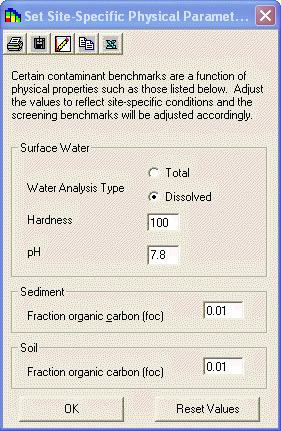
Setting Physical Parameters(table)
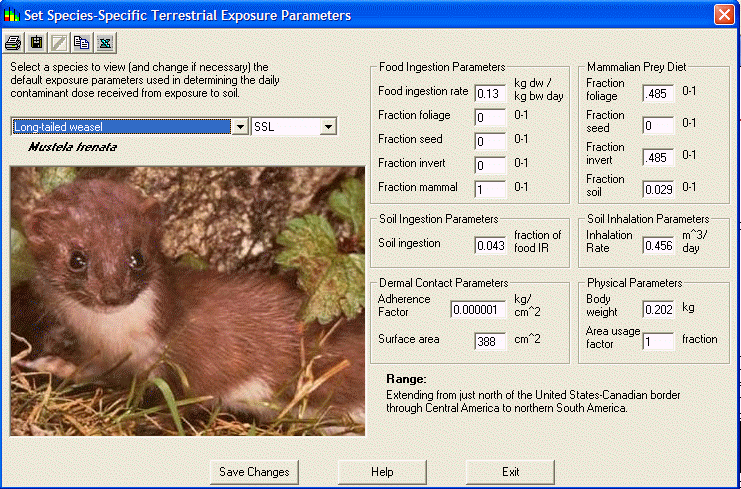
Callibrating Receptor Characteristics
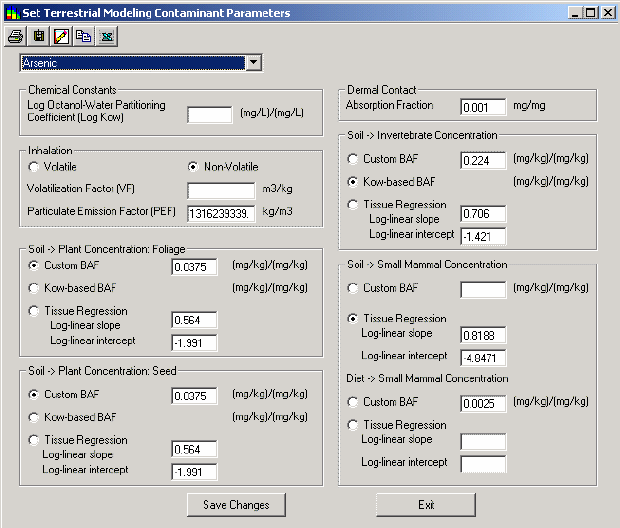
Setting Contaminant Uptake Parameters
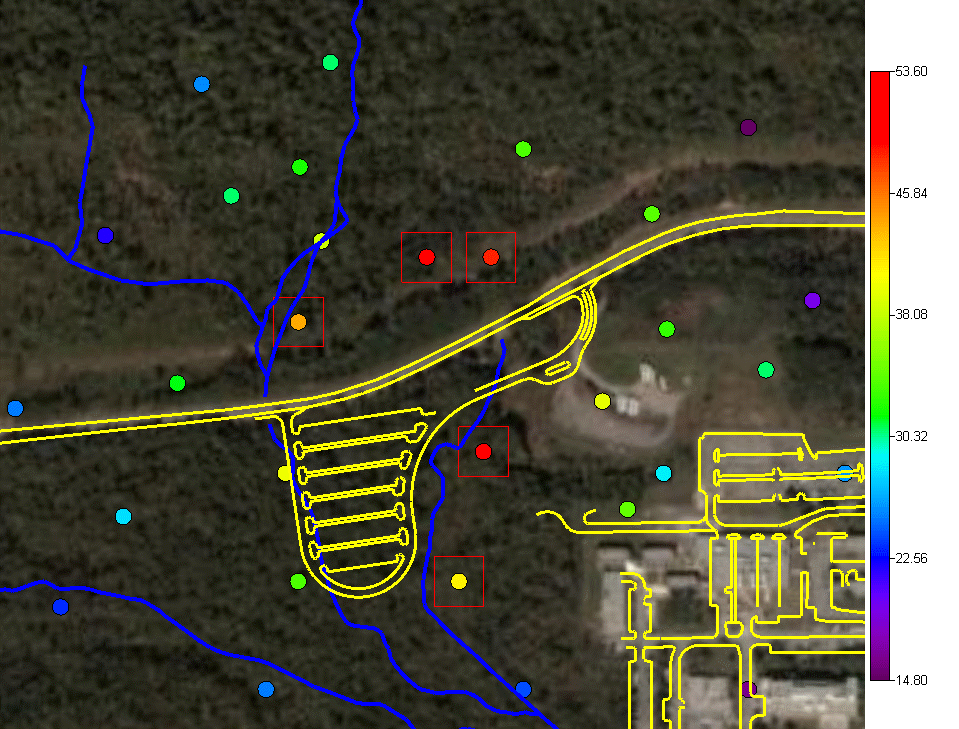
Ecological risk can directly contribute to geospatial modeling and decision processes. In the following images, we see the translation of risk into a spatial context, uncertainty, and decision support. Benchmark Screens (boxes indicate exceedances; shown here arsenic against Dutch Intervention Benchmark)
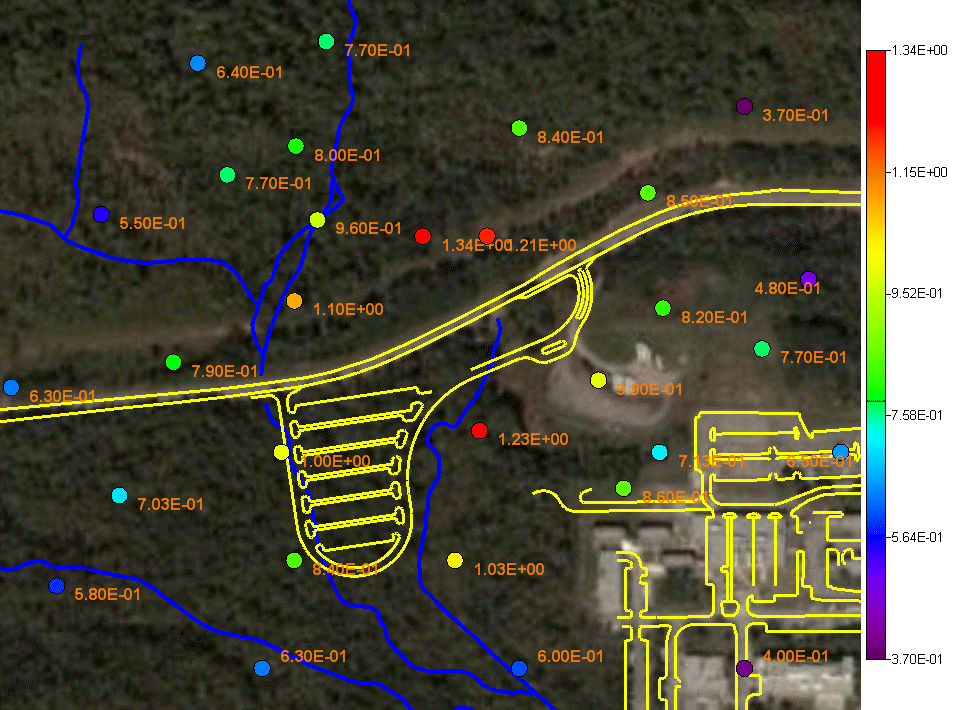
Point Risk (ratio) (shown here arsenic with Dutch Intervention Benchmark)
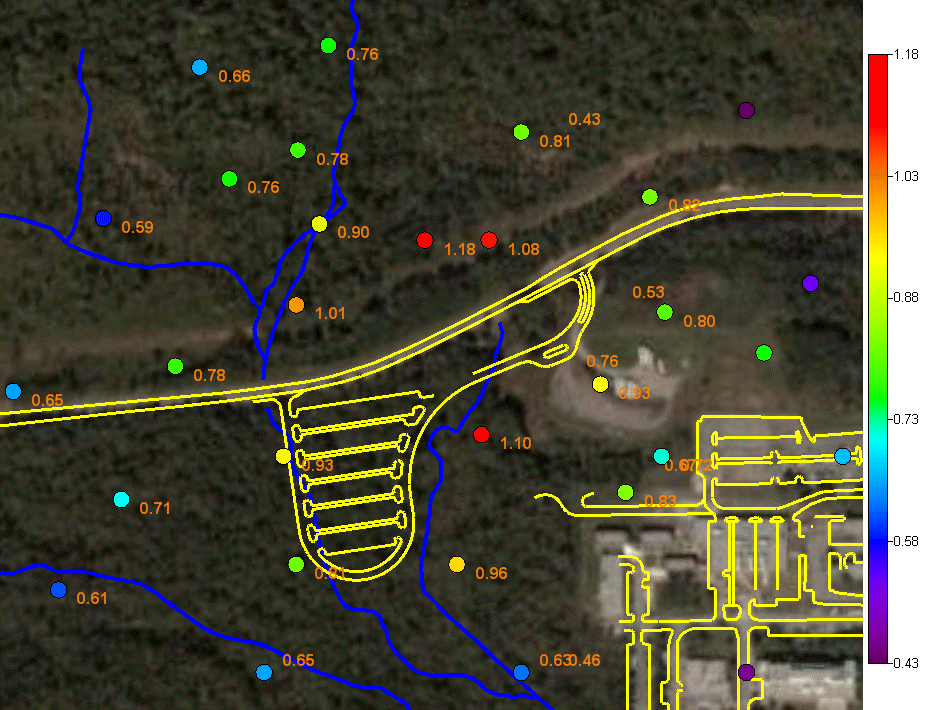
Point Dose (shown here arsenic with short tailed shrew in soil)
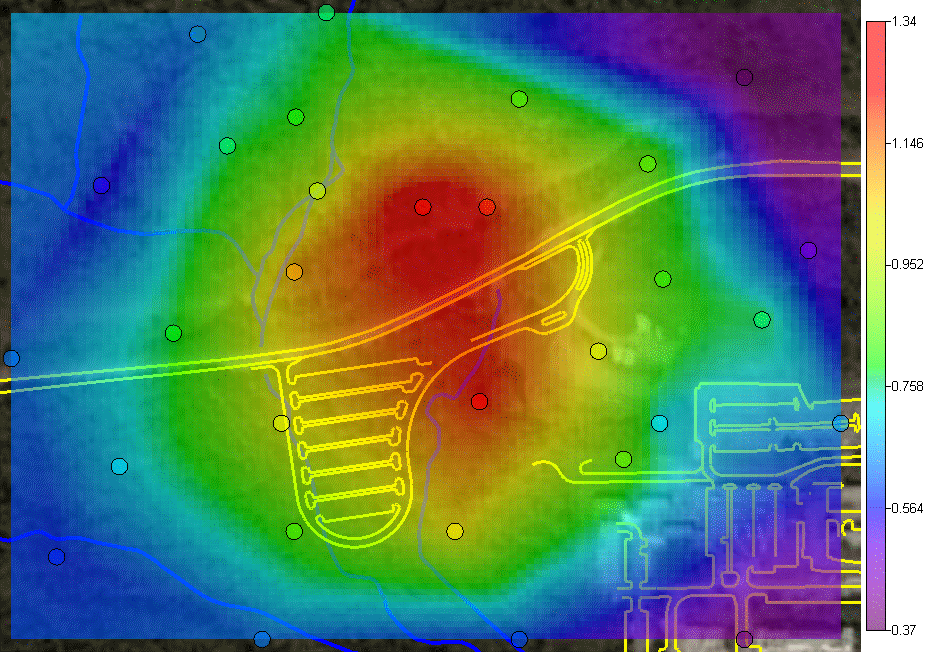
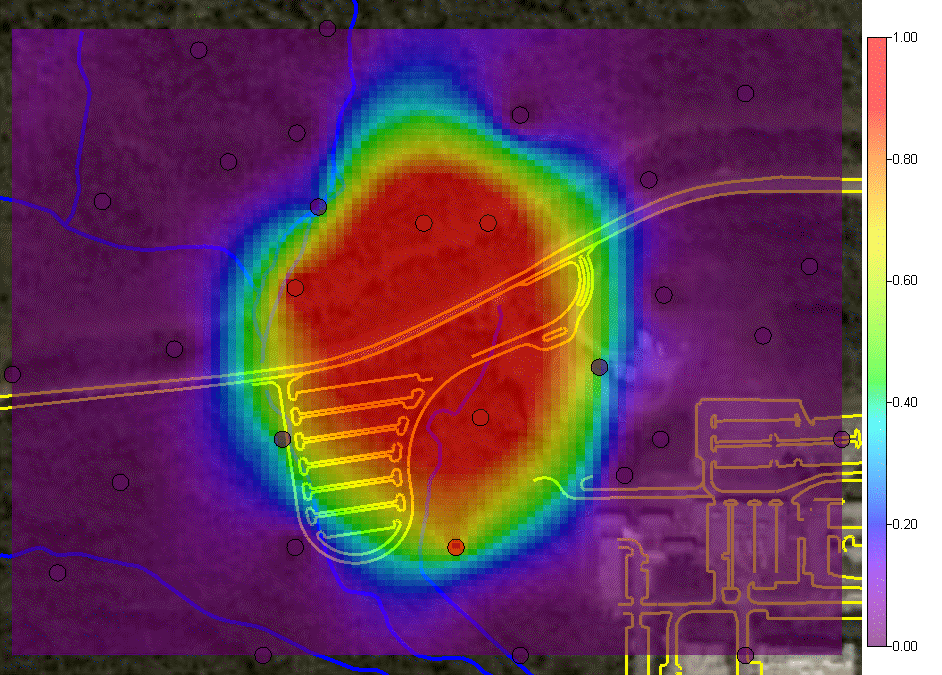
Contoured Risk (shown here arsenic ratio map using Dutch Intervention Benchmark)
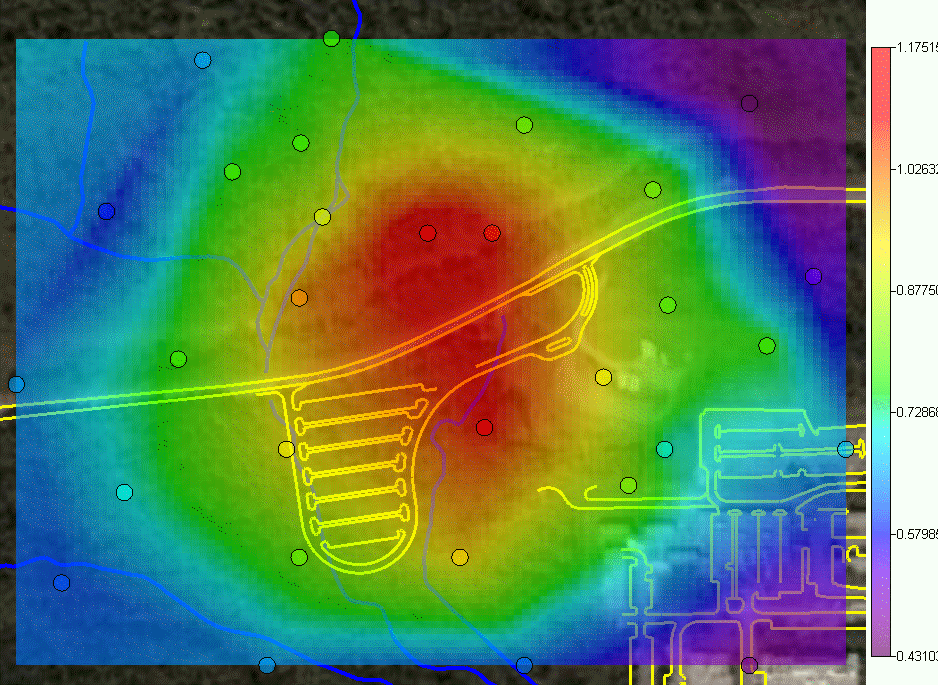
Contoured Dose (shown here arsenic dose map for short tailed shrew)
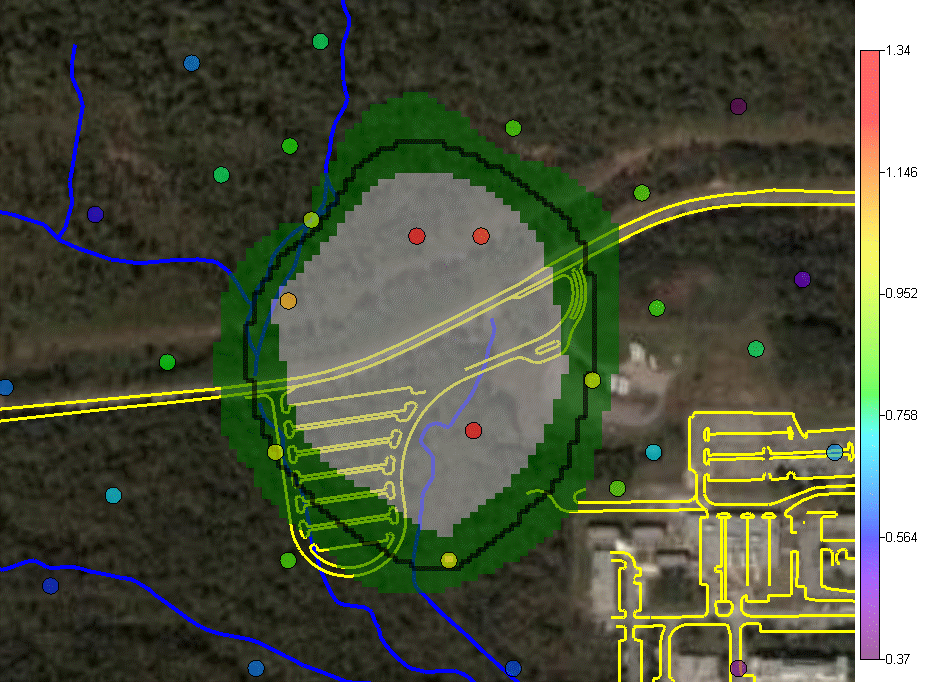
Probability Of Exceedance (shown here probability of arsenic exceeding Dutch Intervention Benchmark)
Decision Support (shown here an area of concern for arsenic using Dutch Intervention Benchmark; green areas indicate uncertainty in the boundary)
Supporting Sampling Designs To see how risk is used in development of sampling designs see sample designs. Additional ecological risk links are given below:
Tox data: Calculating Doses |

SADA Main Page Free Downloads Visualization Sampling Data Exploration Risk Assessment Geospatial Analysis Geospatial Simulation Decision Analysis Cost Benefit Anaylsis MARSSIM TRIAD Other Tools Technical Support Documentation Coming Soon Training Education Applications Join SADA User Group RAIS Bugs People Email Us