Minimizing/Maximizing Area of Concern is a secondary sample design that generates new samples in locations that might minimize or maximize the area of concern. In the case of minimizing the area of concern, this method (based on the approach used by Dr. Bob Johnson at Argonne National Laboratory) tends to "march sample points" inward toward the area of concern. See Minimizing/Maximizing Area of Concern Discussion for more information on this sample design.
Availability
This sample design is available for SADA files with sampled data or with Geobayesian data.
Steps
These are the steps that display in the Steps Window when this sample design is selected during the step Set sampling parameters. Click on the links below for more details about the following steps. Note: With Geobayesian data, SADA will automatically change the interpolant to kriging and not allow the user to alter this.
1. See the data, Draw/Edit Prior
5. Set update data (for Geobayesian files only)
6. Set grid specs (not available for Geobayesian)
7. Interpolation methods (not available for Geobayesian)
8. Correlation modeling (If indicator kriging or ordinary kriging )
10. Show the results
12. Format picture
13. Auto-document
Design-specific Parameters
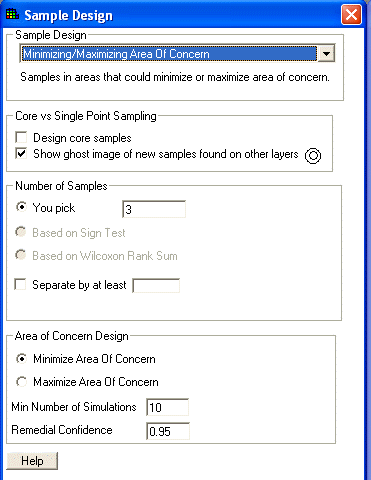
When Minimizing/Maximizing Area of Concern is selected during the Set sampling parameters step, the Parameters Window changes to look like the following:
See Design Core samples or Show Ghost Image for an explanation of the core vs. single point sampling options.
Under Number of Samples, only "You pick" is available. Enter the number of samples in the space provided.
To use the secondary minimum distance constraint, enter a value next to Separate by at least.
Select the type of Area of Concern Design and enter the minimum number of simulations and the remedial confidence.
Press Show the Results on the Steps Window. After asking for the decision criteria, SADA will display the sample locations in the Graphics Window. If there are polygons, new samples will only be placed inside the active polygons.
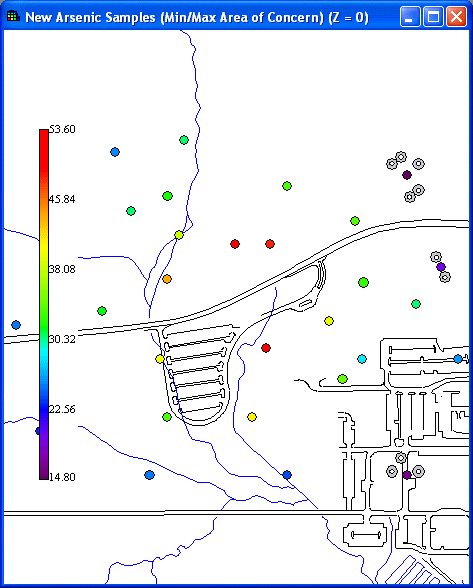
To view the actual coordinates of the new sample points export the information to a comma delimited excel file by using the Output to File toolbar button in main form of SADA.