This step is available when one of the following interviews is selected: Model Spatial Correlation, Draw a Variance Map, Draw a probability map, Update My Prior Probability Map, Update My Prior Variance Map, and sometimes Interpolate my data, Draw an Area of Concern Map, Calculate Cost versus Cleanup, Draw a Contoured Risk Map, Draw a Contoured Eco Dose Map, and sometimes Develop a sample design.
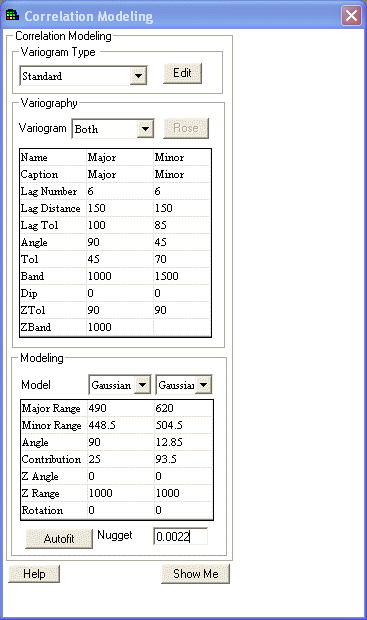
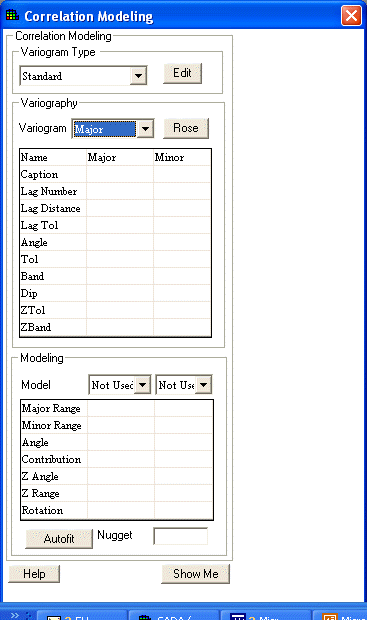
Select Correlation Modeling from the Steps Window. SADA will display the following in the Parameters Window.

At the top of the tab in the drop down box under Variogram Type, select the default ‘OK’ option (for untransformed data) or create indicator cutoff threshold values. (See Spatial Correlation and indicator kriging.)
SADA allows the results of two separate cones to be viewed at once to provide visual comparison and check for anisotropic correlation. (It is recommended that the user plot the major and minor axes; however, the cones do not need to be orthogonal to each other for simple viewing. If the model is used in OK or IK, they are considered orthogonal.)
Enter the appropriate parameters in the Variogram table. Each cone is identified by its Caption.The Angle parameter refers to the direction of the cone (measured clockwise from the positive y axis), the Tol parameter refers to the angle tolerance, and Band refers to the constraining bandwidth parameter. For the case of three dimensional data, the position of the cone in space is further specified by: Dip - the angle below the plane that is always negative, ZTol - the tolerance angle for Dip, and ZBand - constrains the cone in the vertical direction. (Note: the 3d parameters are disabled for 2d data.)
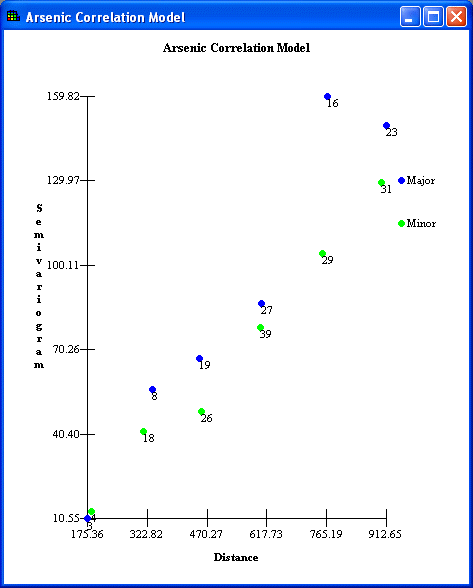
In the drop down box next to Variogram, select ‘Major’, ‘Minor’, ‘Both’, or ‘Nothing’ to define the cones that are included in the graph of semivariogram results.
Select the Rose button to view the rose diagram for the data. This diagram can be used to set appropriate semivariogram parameters.
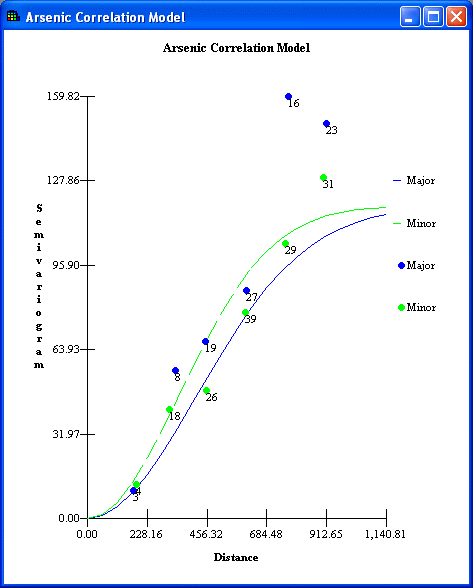
Press the Show Me button on the bottom of the window. The semivariogram results are calculated and plotted for each cone in the Graphics Window. The result of calculating the semivariogram for every lag is a series of semivariogram points. The major direction will appear blue while the minor direction is green. These variography results may be modeled separately or combined with a correlation model.
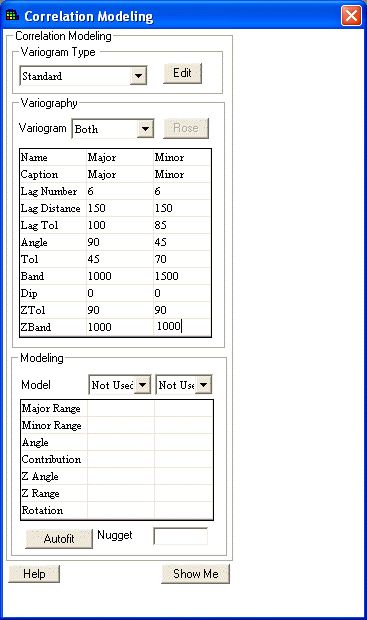
To fit a correlation model to the semivariogram results, enter the appropriate values in the second table on the Parameters Window.
The models are located in the drop down boxes next to Model; there are two available for nested structures. Below each model are the parameters for fitting the semivariogram values.
Anisotropy in space is characterized by an ellipsoid model. This model is exactly the same as defining a neighborhood, which characterizes how points are estimated in space and is described by the following parameters.
Major Range – correlation length along the major anisotropic axis.
Minor Range – correlation length along the minor anisotropic axis.
Angle – The angle of anisotropy in the XY plane (equal to the major axis angle in experimental variography).
Contribution – The model’s contribution to the sill (maximal model value).
Z Angle – The angle of anisotropy in the Z plane (equal to the Dip parameter in experimental variography).
Z Range – A value describing how anisotropy behaves in the z minor direction, relative to major axis.
Rotation – How the anisotropic ellipsoid is rotated about its major axis.
Nugget – the semi-variogram value as distance between points approaches zero; sometime referred to as noise effect.
To visualize how these parameters effect the ellipsoid, see Defining a Neighborhood. For more sophisticated modeling, the Angle and Z angle do not need to equal their experimental variography counter parts, Angle and Dip. Note: this level of detail in fitting semivariogram models is not usually necessary.
Use the Autofit button for SADA to help fit the correlation to the semivariogram values.
Press the Show Me button to view the results in the Graphics Window.
