With Hot Spot: Calculate Probability, the user defines the grid and the hot spot size, shape and orientation.
Availability
This sample design is available for all SADA files.
Steps
These are the steps that display in the Steps Window when this sample design is selected during the step Set sampling parameters. Click on the links below for more details about the following steps.
1. See the data, Draw/Edit Prior, Display empty plot
9. Add to results gallery (not available for empty SADA files)
Design-specific Parameters
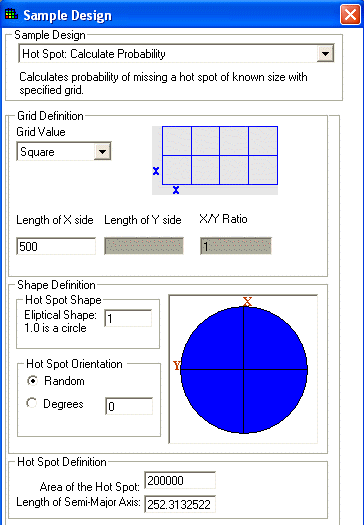
When Hot Spot: Calculate Probability is selected during the Set sampling parameters step, the Parameters Window changes to look like the following:

Under Grid Definition, select a square, triangle, or rectangle grid style and enter the Length of X side.
Enter the parameters for Shape Definition. For Hot Spot Shape, enter a value that is greater than or equal to .2 and less than or equal to 1. This is the ratio between the major and minor axes of the elliptical hot spot. (Note that 1 is a circle.) For Hot Spot Orientation, select Random to use omni directional ellipses, or select Degrees and enter a value between 0 and 90.
Define the Hot Spot Definition by setting either the area or the length of the semi-major axis (note that the other value will change accordingly).
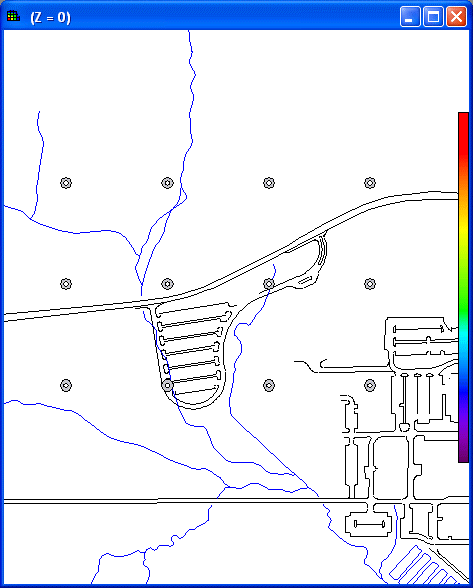
Press Show the Results. SADA will present a message re the number of new samples and their probability of hitting a hot spot before displaying the new sample locations in the Graphics Window. If there are polygons, new samples will only be placed inside the active polygons.


To view the actual coordinates of the new sample points export the information to a comma delimited excel file by using the Output to File toolbar button in main form of SADA.