Once one or more MARSSIM sample designs have been locked, users can import sampled data. Once data is imported into SADA, they user can no longer create new MARSSIM sample designs. If unsure about the need for more additional designs, a backup of the file should be made prior to importing new data.
Click on "Import Sampled Data to begin". SADA will present the locked designs and confirm that these are all the designs needed. SADA proceeds through the normal import data process. Once complete, SADA presents the user with the opportunity to now set up the SADA file for MARSSIM. Users can only set up a SADA file for MARSSIM analysis if there are locked MARSSIM designs available. You can choose to set the MARSSIM analysis up now or later select Setup MARSSIM from the Setup menu.
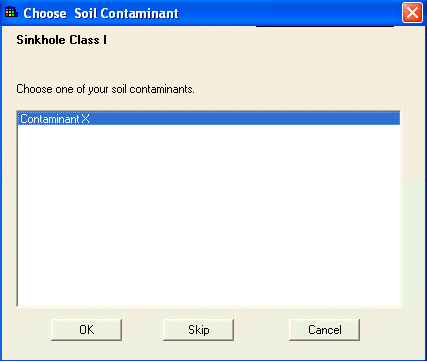
For each MARSSIM design, you may choose only one contaminant to perform a detection test at a time. When setting up the MARSSIM analysis, SADA presents the following form.
For each MARSSIM design choose a contaminant. The MARSSIM design is bolded at the top. If the user does not wish to associate the selected MARSSIM design with a contaminant press Skip.
Once all the associations have been made and the MARSSIM analysis has been completed the user will have access to the MARSSIM analysis functions and the data.
Once the setup is complete, switch to MARSSIM data analysis in the interview box. SADA permits only one action under MARSSIM: Perform MARSSIM Analysis (Scenario A).
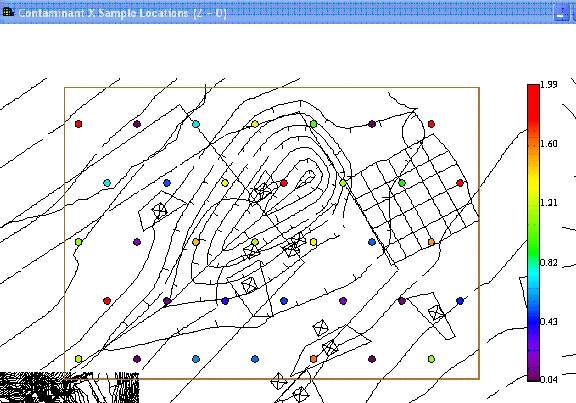
Like all analysis types, only those contaminants involved in the setup are available in the drop down list. Choose the contaminant of interest and the associated MARSSIM locked design will present itself in a design/data combo plot. This plot shows where samples were planned versus where they were taken. Press Show the Results to run the test for detecting elevated areas.
There are 5 primary steps to the MARSSIM analysis
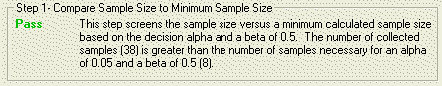
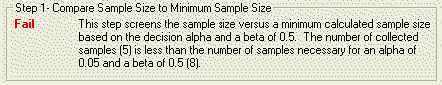
1. Compare sample size to minimum sample size
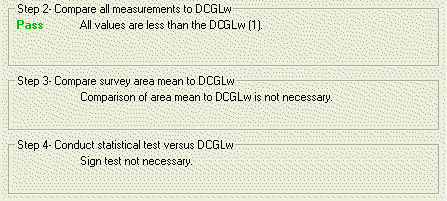
2. Compare all measurements to a DCGL value
3. Compare survey area mean to a DCGL value
4. Conduct statistical test versus DCGL value
5. Compare all measurements to a DCGL value
The exact values used vary for the Class type and there are differences in the statistical test based upon whether background data is available (WRS Test) or not (Sign Test).
Step 1: Compare sample size to minimum sample size
An alternative sample size is calculated based on the alpha decision error and a beta error of 0.5. This sample size is compared to the number of actual samples for that analysis. If there are sufficient samples then the user will get a message:
If there are not enough samples then the message will indicate that the user failed step 1:
Step 2: Compare all measurements to DCGL value
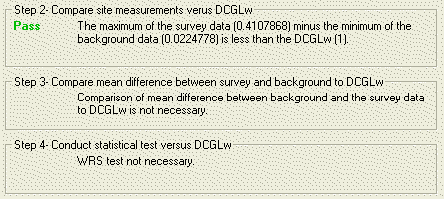
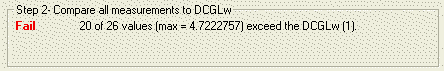
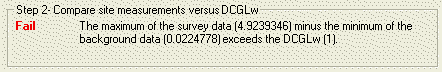
In this step, for the Sign Test, all the measurements are individually compared to the DCGL value. The step will indicate the number of samples that exceed the DCGL. If all the measurements are below the DCGL then the message will indicate that the user has passed and that steps 3 and 4 are not necessary. For the WRS test, the maximum of the sample data is compared to the minimum of the background data. If this maximum value minus the minimum of the background data is greater than the DCGL then steps 3 and 4 are not necessary.
For the Sign Test:
For the WRS Test:
If some of the values are greater than the DCGL for the Sign Test than steps 3 and 4 are necessary and the user will get a message indicating the number of samples in exceedance.
Likewise, if the maximum of the survey data is greater than the minimum of the background data by the magnitude of the DCGL then the user will get a failure message.
Step 3: Compare survey area mean to a DCGL value
If step 2 fails, then a comparison is made. For the Sign Test, the comparison is between the mean of the data and the DCGL. For the WRS test, the comparison is between the mean of the survey data and the mean of the background data. If the comparison fails then step 4 is not necessary.
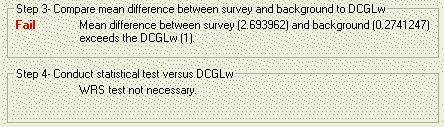
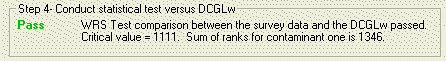
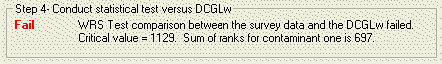
Step 4: Perform statistical test
Performing the actual statistical test is necessary when step 3 fails and step 4 passes. The result of the test will be given along with the significance statistics.
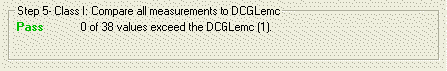
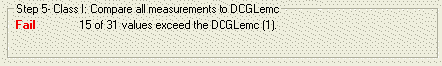
Step 5: Compare all measurements to DCGLemc
Individual measurements are compared to the DCGLemc, if any locations exceed this value, then the site fails this step.
An overall summary is given at the bottom of the form, this text indicates whether the site passed overall or not based upon the results of the 5 steps.
![]()
![]()
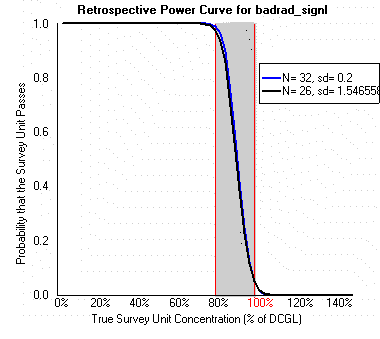
Retrospective power curves
Retrospective power curves are generated based on the original power curve from the locked design and an updated curve that is a function of the actual number of samples collected and the standard deviation of the collected data. Depending on how similar these values are from the survey data compared to the original locked design, the power curves will either closely track each other: