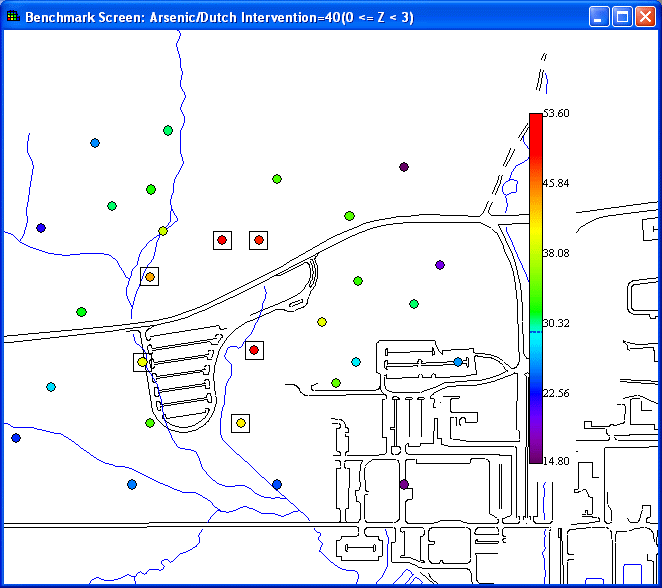
With data screen maps, the user can screen the data against ecological benchmarks.
From the Interviews list, select Draw a data screen map. Follow the steps that are listed.
Availability
This interview is available for ecological analyses with all data types except Geobayesian.
Steps
These are the steps that display in the Steps Window when this interview is selected. Click on the links below for more details about the following steps.
1. See the data
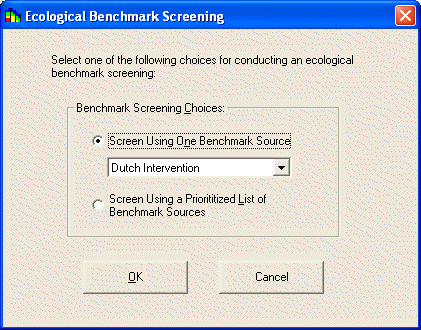
Make sure that the analysis type is set to Ecological and the desired contaminant and media are selected in the secondary toolbar. When Show the results is selected, SADA will prompt the user to select the ecological benchmarks to be screened against:
To select a single benchmark source, select Screen Using One Benchmark Source. To screen against a prioritized list, select Screen Using a Prioritized List of Benchmark Sources and the following form appears:
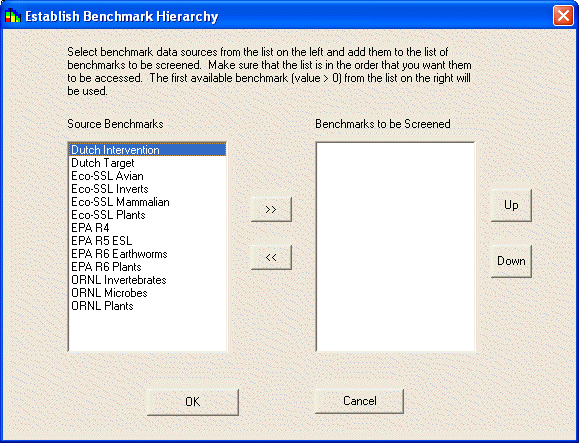
Here you can select which benchmarks are to be screened using the >> button and the order in which they will be accessed using the Up and Down buttons. Clicking OK will then display the map with a box around each point that exceeds the chosen benchmark.