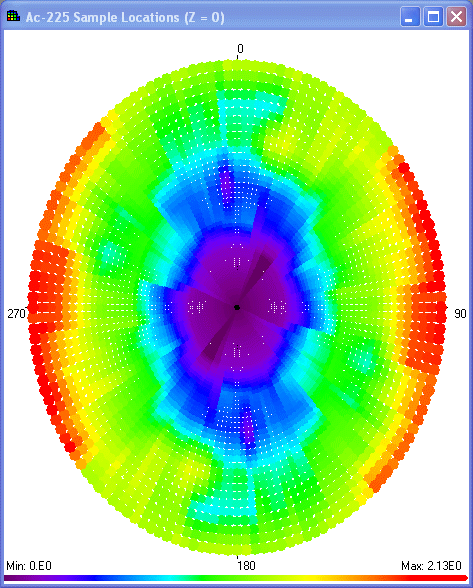
Rather than viewing only one angle at a time, users can view semi-variogram values in all directions at once with the rose diagram. A Rose Diagram is used to display correlation models for angles ranging from 1 through 180 degrees simultaneously. The semi-variogram magnitude is represented by a continuous color legend. This legend is displayed on the bottom of the Graphics Window with the maximum and minimum value bounds.
To draw a rose diagram press the rose button ![]() on the Parameters Window when correlation modeling is selected in the Steps Window.
on the Parameters Window when correlation modeling is selected in the Steps Window.

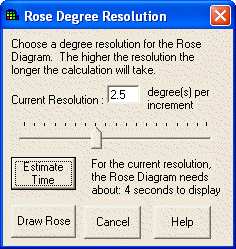
Use the slide bar to give a rose picture resolution. The higher the resolution, the longer it will take to calculate and draw the Rose Diagram. Press the Estimate Time button to estimate how long it will take to calculate the rose diagram. For large data sets, it may take an exceptionally long time to calculate the Rose diagram. Press Cancel in the Rose Diagram Window to stop the drawing of the rose diagram. Otherwise, press Draw Rose.

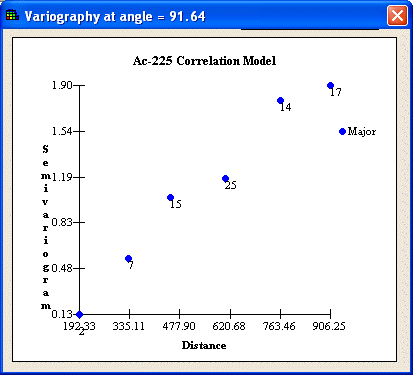
To see the individual angle variography model for any of the angles in the rose diagram, just click on the desired angle inside the Rose diagram. This launches the Rose Diagram Window.

Invalid angles, or angles that don’t produce lags, are show as a black radial line inside the rose diagram. The angle that does not have extreme values and also has a smooth increase in value may be the direction of anisotropy.
Note: There are certain restrictions with rose diagrams: only one cone definition at a time can be used when creating a Rose diagram and at least 2 lags for each direction are required.