This step is available when one of the following interviews is selected: Interpolate my data, Draw an area of concern map, Draw a contoured risk map, and Draw a contoured eco dose map.
This step estimates the error in the value of existing data. Cross validation is performed on each existing data point by removing that data point from the available set of data points and estimating the value at the location of the removed point. The estimation uses the interpolation scheme, grid specs, and search neighborhood that were defined previously. The difference between the estimated value and the actual value at the removed data point is the error estimate. This error can be viewed as an actual error, absolute error, or a percentage error.
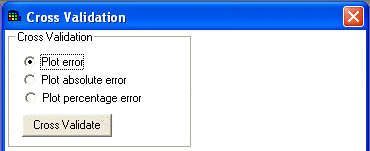
Select Cross Validation from the Steps Window. The following information is displayed in the Parameters Window.

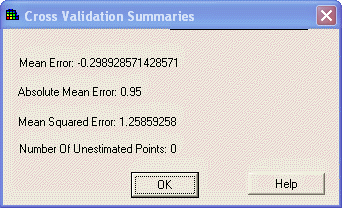
Choose the type of error that should be displayed and press the Cross Validate button. SADA presents these site wide error statistics: Mean Error, Absolute Mean Error, and Mean Squared Error as well as the number of un-estimated data points.

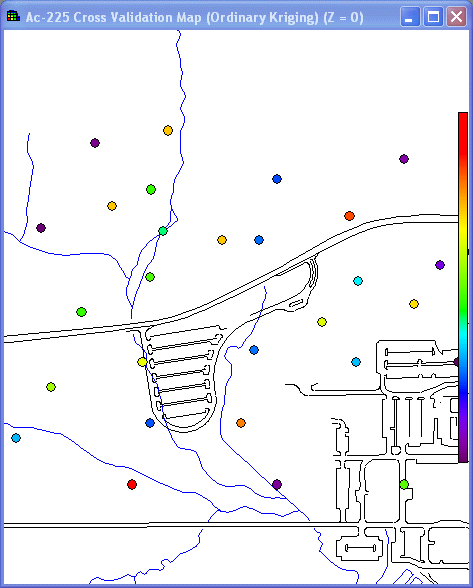
Press OK to see the results in the Graphics Window.

Notice that cross validation changes the picture in the Graphics Window. The window now shows a data plot where the color of each data point corresponds to the error associated with that data point. If the legend is continuous, then the legend also changes to reflect the new range of values that is associated with the color scheme.