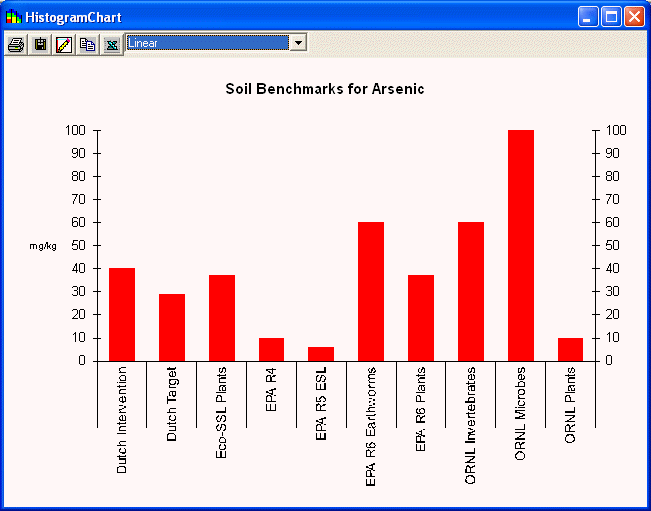
In order to show a benchmark histogram for a given contaminant that is in your SADA file, make sure that your analysis type is set to Ecological and the desired contaminant and media are selected in the secondary toolbar.
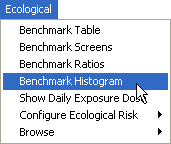
From the Ecological menu, select Benchmark Histogram.
This will automatically display the available benchmarks in a histogram. If applicable, the benchmarks will be based on the physical property value currently stored in the SADA file (as opposed to the Browse Benchmark Histogram, which is always based on default properties).