Custom analysis results may be used in Spatial Screens, Probability Maps, Area of Concern Maps, or Cost Benefit Analysis Maps. Select the custom analysis in the analysis type box of the secondary toolbar.
When one of the following interviews is selected:
· Calculate cost versus cleanup
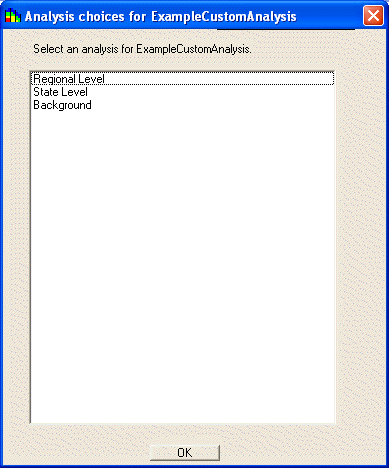
the following window will appear.

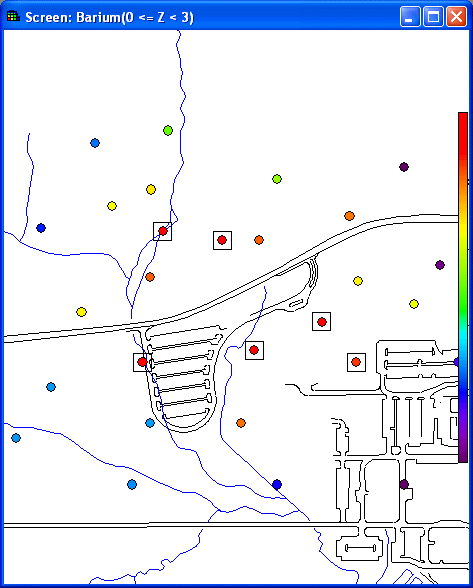
Select the analysis choice (the list will include all column headings from the external database except Contaminant Name and CAS Number) and press the OK button. In the following example, State Level has been used in to Draw a data screen map. Boxes surround the data points that exceed the screening value for the selected contaminant.

Spatial Screen Against State Levels for Barium in Soil