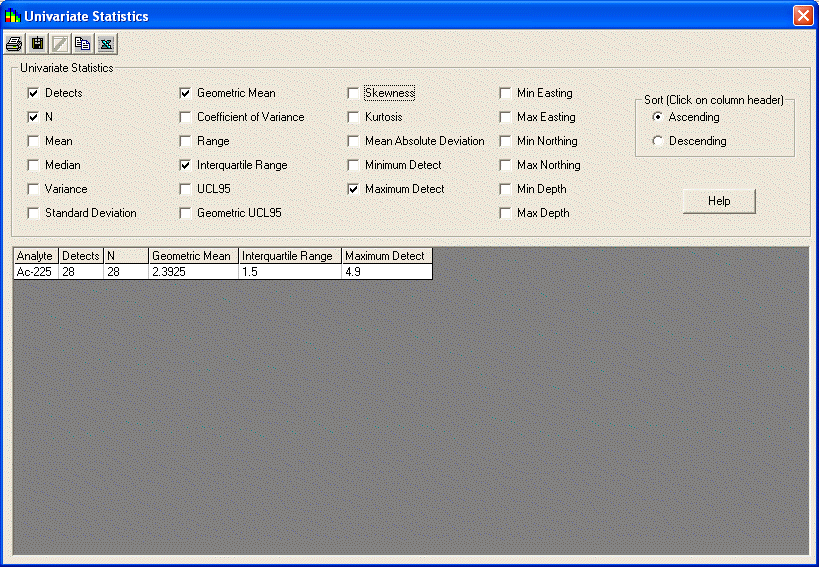
Use the Statistics button to calculate univariate statistics on every data point (or modeled value). When a polygon tool is on, this feature will return only those points found in the polygon. Select and deselect individual statistics to display them in the spreadsheet.
Detection Frequency- the number of total samples that were detected, presented in the form (detected/total N)
Mean- the sum of the values of a variable divided by the number of values
Median- the value below which 50% of the data values fall
Variance- a parameter that measures how dispersed a random variable’s probability distribution is, the mean of the squares of the differences between the respective samples and their mean
Standard Deviation- the positive square root of the variance
Mean Absolute Deviation- the mean of the absolute values of the differences between the respective samples and their mean
Coefficient of Variance- the ratio of the variance over the mean
Interquartile Range- the central portion of a distribution, calculated as the difference between the third quartile and the first quartile; this range includes about one-half of the observations in the set
Range- the difference between the lowest and highest values
UCL95- upper 95% confidence limit on the mean concentration of a normal distribution
Skewness- is a measure of symmetry, skewness for a normal distribution is zero, and any symmetric data should have a skewness near zero. Negative values for the skewness indicate data that are skewed left and positive values for the skewness indicate data that are skewed right
Kurtosis- Kurtosis is a measure of whether the data are peaked or flat relative to a normal distribution. Data sets with high kurtosis tend to have a distinct peak near the mean, decline rather rapidly, and have heavy tails. Data sets with low kurtosis tend to have a flat top near the mean rather than a sharp peak.
Geometric Mean- the mean of n numbers expressed as the n-th root of their product
Geometric UCL95- upper 95% confidence limit on the mean concentration of a lognormal distribution
Minimum Detect- the lowest detect value found in the dataset
Maximum Detect- the highest detected value found in the dataset