Indicator kriging relies on models that quantify the spatial correlation among data values under the indicator transform. For a given threshold value, the indicator transform function assigns a value of 1 for data less than the threshold and 0 if it is greater. The semivariogram is then calculated using these transformed values.
In indicator kriging, the range of data values may be partitioned by a series of threshold values. For each one of these threshold values, the indicator transform is produced and a geospatial model of correlatoin must be available.
The indicator cutoffs are selected from the drop down box at the top of Parameters Window when Correlation Modeling is selected from the Steps Window.
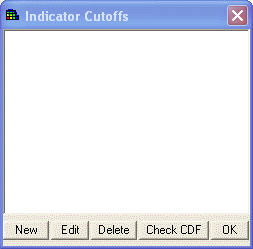
Click on the Edit box next to Variogram Type to create new cutoff threshold values or to edit or delete existing values. SADA will open the Indicator Cutoff window.

To create a new value, select New and enter a new cutoff value. To edit a value, select the value in the Indicator Cutoffs window and press Edit. To delete a value, select the value and press Delete. To check if the values are appropriate for the data set, select Check CDF. After making changes, press OK. The new set of indicator cutoffs will appear in the drop down box on the Parameters Window in ascending order.
For each cutoff threshold, define the major and minor parameters. The major direction is always highlighted in blue while the minor direction is green.