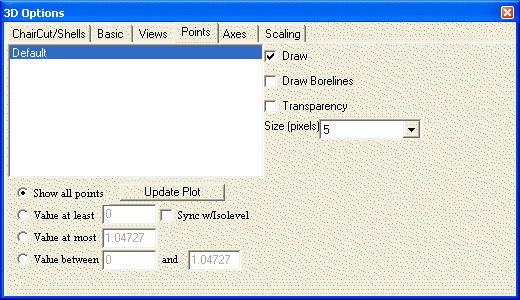

This tab can be used to set options related to how the points are displayed. On the left will be a list of the different point groups defined (in SADA Version 3, there is only a single point group, named "Default").
Draw
This box indicates whether or not to draw the points in the current view.
Draw Borelines
If this box is checked, a line will be drawn from each point in the group to the surface (z=0).
Transparency
If this box is checked, then the point will be transparent. The degree of transparency depends on the value at the point.
Size (pixels)
This box determines how large the displayed points are, in units of screen pixels.
The options at the bottom of the tab may be used to limit the points to those that satisfy certain conditions. In all cases, click the "Update Plot" button to update the image based on the settings.
Show All Points
When this box is checked, all data points will be shown.
Value at Least
When this box is checked, only those points with a value above the specified level will be shown.
Sync w/Isolevel
When this box is checked, only those points with a value that is at least equal to the current isolevel surface will be shown.
Value at Most
When this box is checked, only those points with a value below the specified level will be shown.
Value Between
When this box is checked, only those points with a value between the specified levels will be shown.