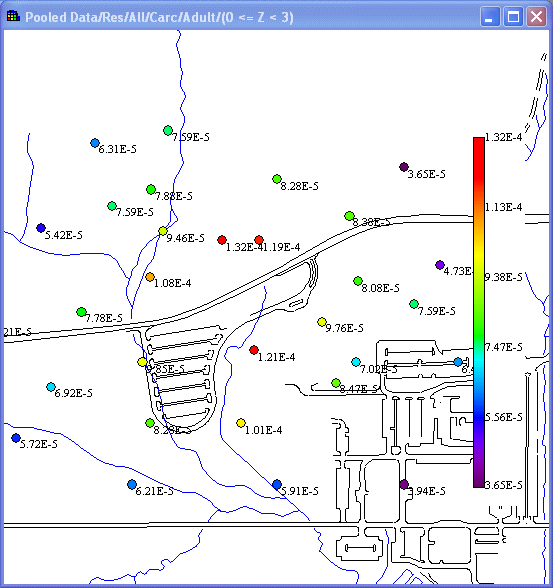
To display concentration to risk at each point, make sure that your analysis type is set to Human Health and the desired contaminant and media are selected in the secondary toolbar.
From the Interviews list, select Draw a point risk map. Follow the steps that are listed.
Availability
This interview is available for human health analyses with pooled or unpooled data.
Steps
These are the steps that display in the Steps Window when this interview is selected. Click on the links below for more details about the following steps.
1. See the data
When Show the results is selected, SADA will present the Risk Scenario selection window. After selecting the applicable land use and pathway(s), select OK. In the Graphics Window, SADA now presents the plotted value (selected through the data labels box) as risk values.
