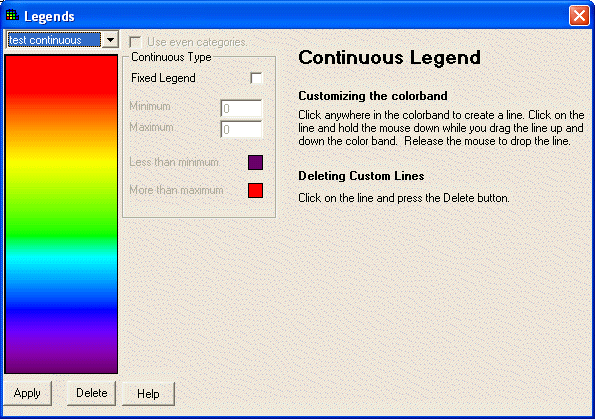
Only user-defined legends may be customized. Select a custom continuous legend or create one if none exists. Steps for customizing the continuous legend are included on the right side of the window for quick reference and are repeated here.
SADA Version 4 now allows the user to create a fixed or unfixed legend.
Unfixed Legends
Unfixed legends work the same as in previous versions of SADA. To color band is stretched between the minimum and maximum values of the dataset.
To stretch or compress the color band, first click anywhere in the color band to create a new line. The line will be tagged at its endpoints with gray boxes. The boxes indicate that this is the active line. Click on the line and hold down the mouse while dragging it up or down the color band. The color band will respond by compressing or compacting the spectrum accordingly. You may create multiple lines.
To remove a line, click on the line and press the Delete button in the window.

Fixed Legends
Fixed legends are new to Version4. In a fixed legend the user determines the minimum and maximum values for the color band.
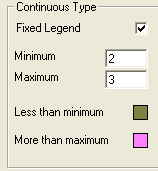
First click on the button next to Fixed Legend to activate this option.

Enter values for the minimum and maximum data. You can also click on the color box next to Less than minimum and More than maximum to change the colors. If your data set extends past your fixed legend, SADA will place a hatch mark on the scale and indicate the range of values above or below the legend with the colors chosen here. The following image shows a scale that does not encompass all the data in the dataset.
![]()